
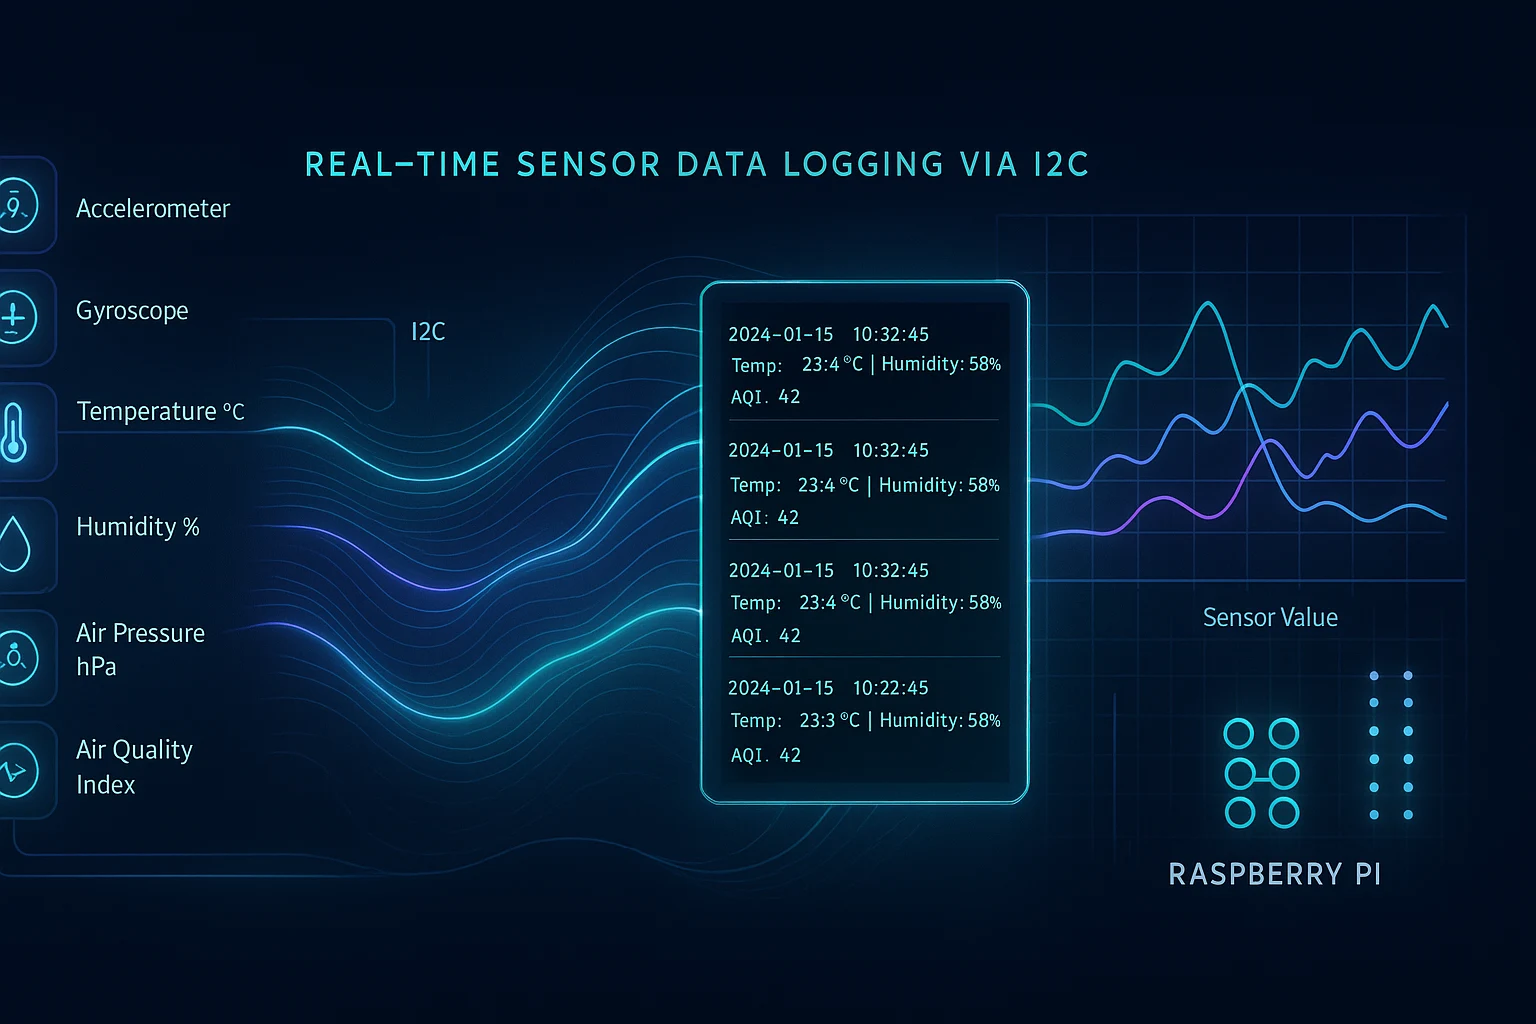
How to Log Sensor Data Raspberry Pi: The Complete Developer Guide
RFOXiA Integrated Sensors Module
How to Log Sensor Data Raspberry Pi Projects Like a Professional Engineer
If you've ever searched for a reliable, repeatable way to capture environmental and motion data from your Raspberry Pi projects, you're in the right place. Whether you're building a weather station, a drone telemetry system, an agricultural monitoring node, or an industrial IoT deployment, understanding how to log sensor data Raspberry Pi setups can collect is one of the most fundamental and valuable skills in modern embedded development.
This guide covers everything — from the basic architecture of a sensor logging pipeline, to the hardware choices that separate hobbyist projects from professional deployments, to the software stack that makes it all run reliably. We'll go deep on I2C communication, data formats, storage strategies, and real-time streaming. By the end, you'll have a complete mental model and a working blueprint for any sensor logging project you want to build.
Why Sensor Data Logging Matters More Than You Think
Data logging isn't just a convenience feature — it's the foundation of any intelligent system. Without reliable sensor data capture, you can't:
- Detect anomalies before they become failures
- Train machine learning models on real-world conditions
- Validate the performance of drones, robots, or vehicles in the field
- Contribute to distributed data networks that pay you for your measurements
- Build closed-loop control systems that respond to their environment
The difference between a sensor that beeps an alarm and a sensor that logs structured timestamped data to a database is the difference between a toy and a tool. When you learn how to log sensor data Raspberry Pi projects can generate, you unlock the full potential of every hardware module you attach.
Understanding the Sensor Data Logging Pipeline
Before writing a single line of code, you need to understand the pipeline. Every sensor logging system has the same fundamental architecture:
- Sensor Hardware — The physical transducers that convert real-world phenomena into electrical signals
- Communication Interface — The protocol (I2C, SPI, UART, analog) that carries data from sensor to microcontroller
- Data Acquisition Layer — The code that reads raw values and converts them to meaningful units
- Processing Layer — Filtering, calibration, aggregation, and anomaly detection
- Storage Layer — Local file, database, or in-memory buffer
- Transmission Layer — Optional: pushing data to a remote server, cloud, or data network
- Visualization Layer — Dashboards, plots, or real-time displays
Each layer introduces latency, error, or loss if implemented poorly. A professional logging system minimizes these at every stage.
Choosing the Right Sensors for Raspberry Pi Data Logging
Not all sensors are created equal. When you're selecting hardware for a serious logging project, you need to consider:
- Accuracy and resolution — What's the minimum detectable change?
- Sampling rate — How many readings per second can the sensor provide?
- Interface — Does it speak I2C, SPI, or UART? What's the bus speed?
- Power consumption — Especially critical for battery-powered deployments
- Calibration requirements — Factory-calibrated vs. field-calibrated sensors differ dramatically in deployment cost
- Integration complexity — Does the sensor require companion ICs, or is it fully self-contained?
For most serious Raspberry Pi logging projects, you'll want sensors covering at least these dimensions:
- Motion — Accelerometer and Gyroscope (IMU) for orientation and movement detection
- Navigation — Magnetometer for heading and compass-assisted navigation
- Atmosphere — Temperature, Humidity, and Air Pressure for environmental characterization
- Air Quality — VOC and oxidizing gas detection for indoor/outdoor air monitoring
Building this stack from discrete components means sourcing seven different ICs, designing or buying seven different breakout boards, debugging seven different I2C addresses, and writing seven different driver libraries. That's a significant investment of time and board space before you've written a single logging function.
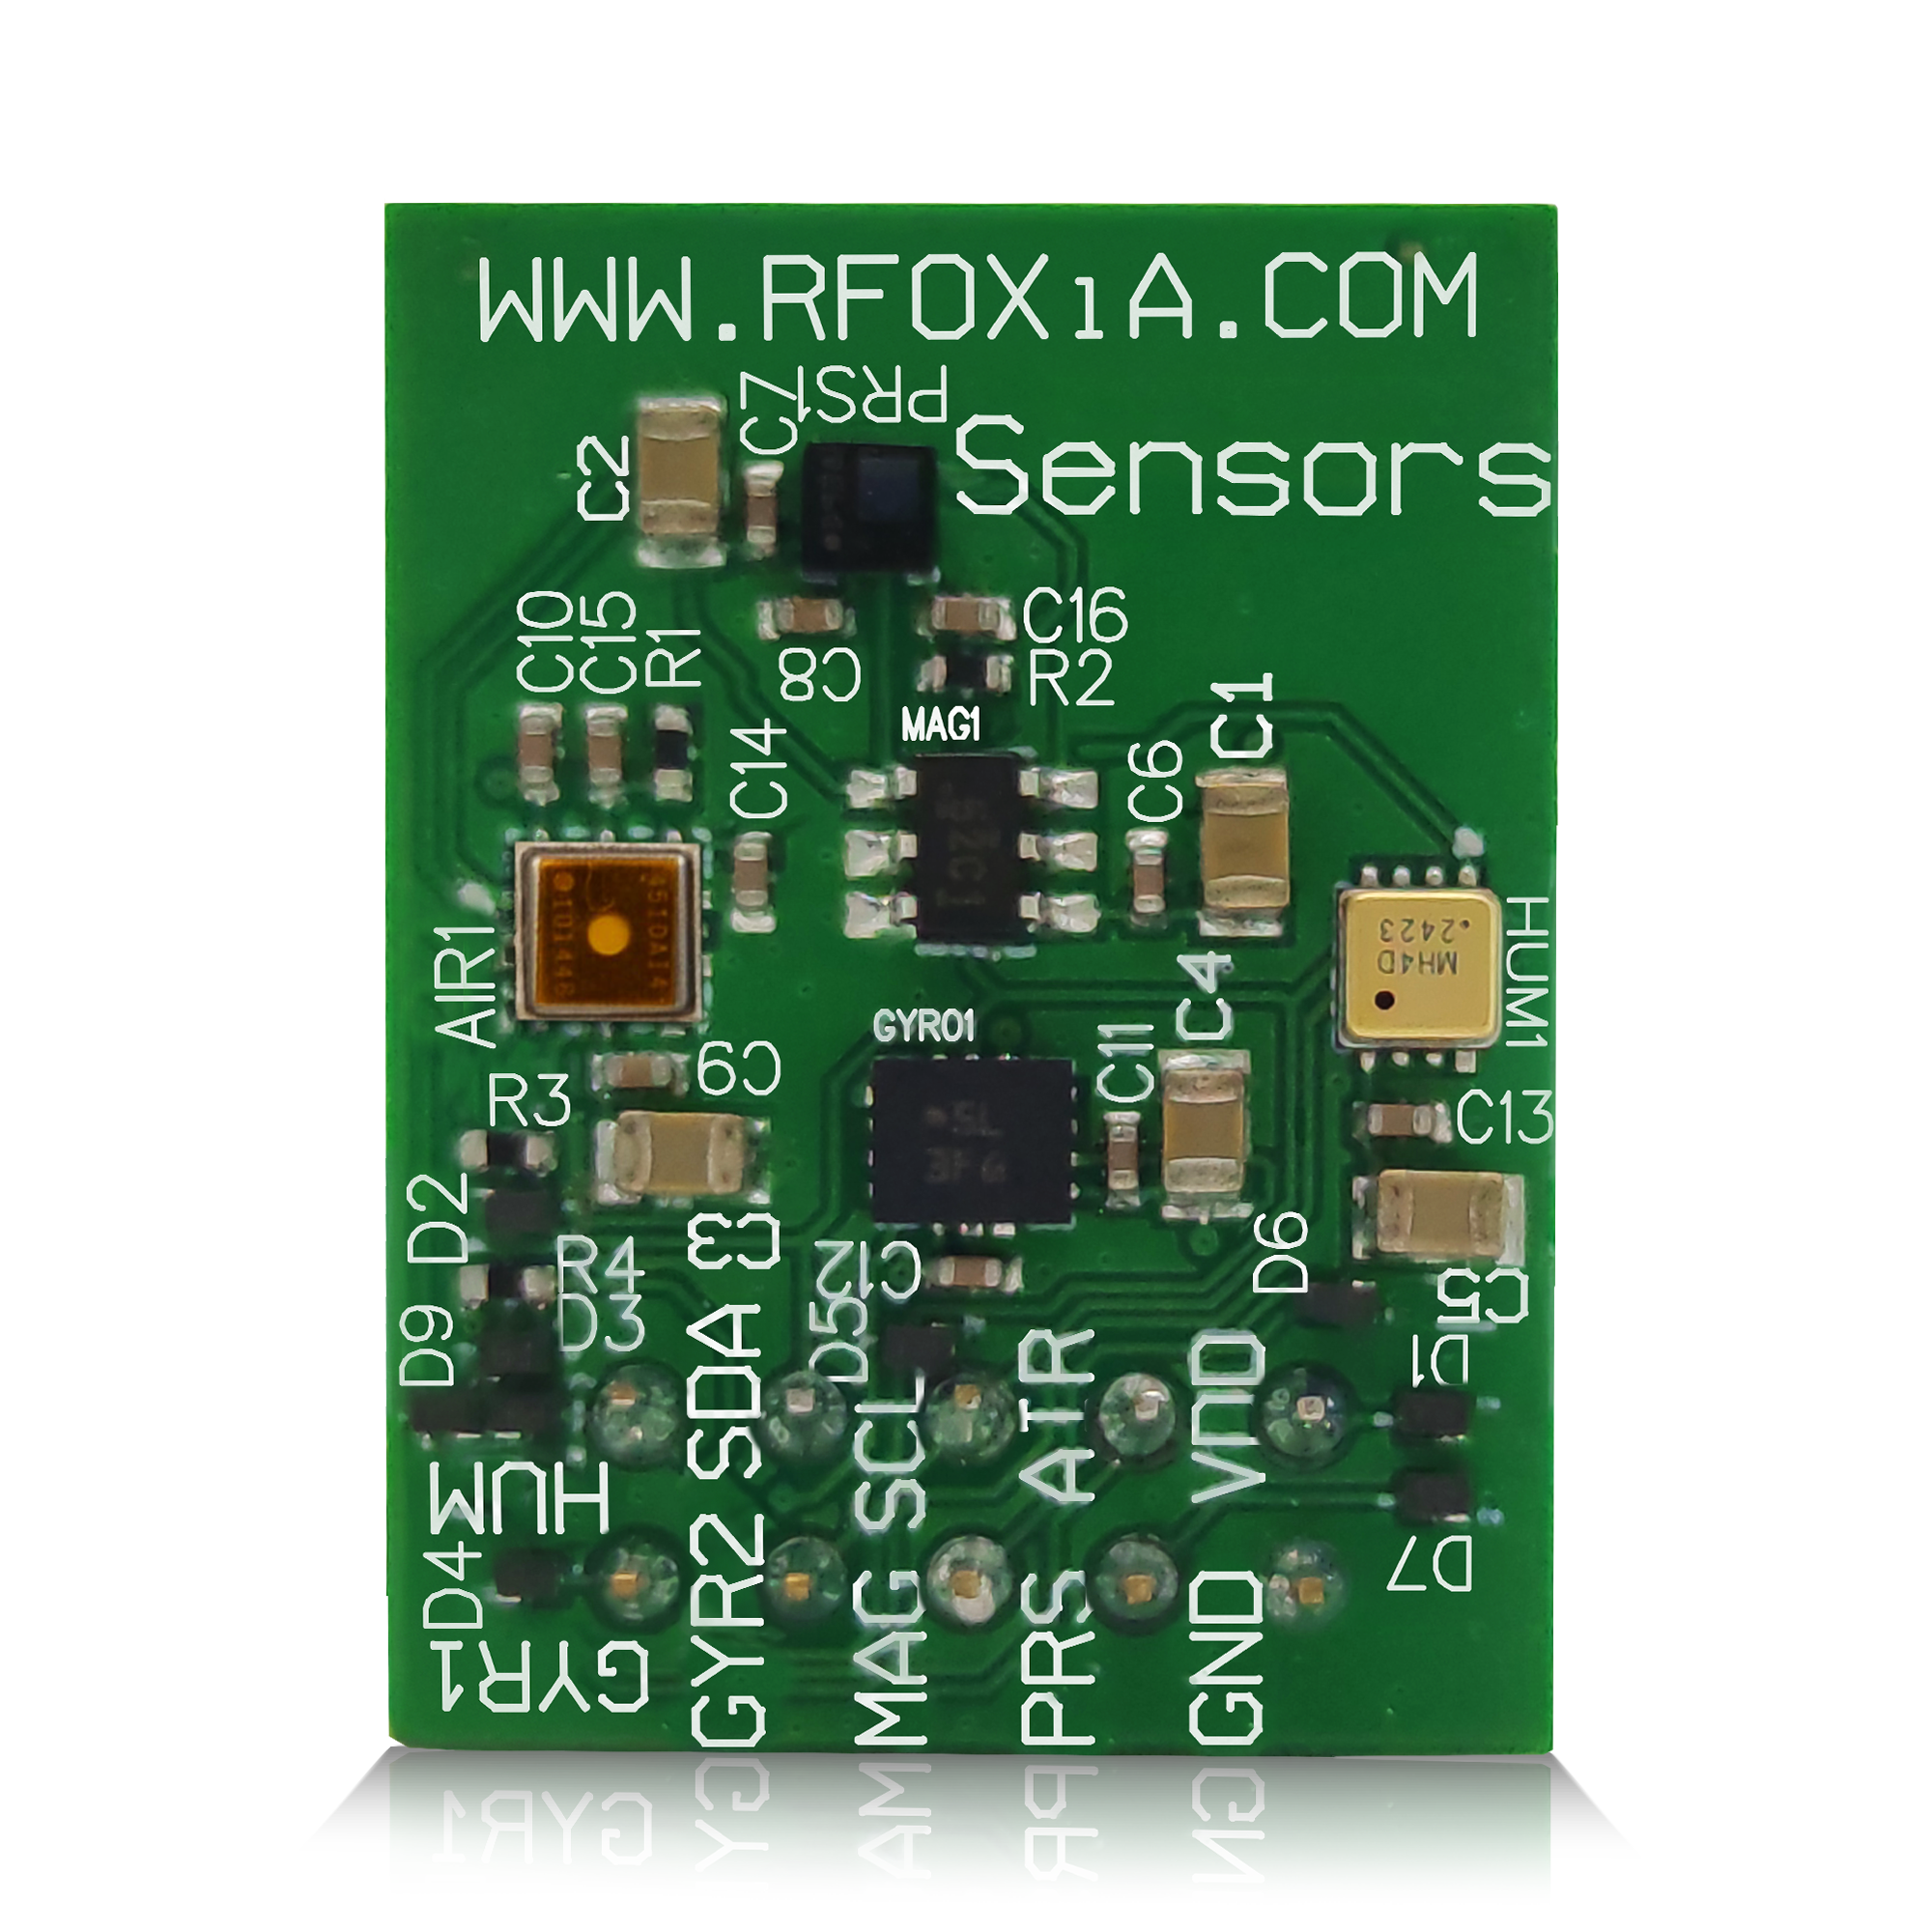
This is exactly the problem the RFOXiA Integrated Sensors Module was designed to solve. By integrating all seven sensors onto a single 24mm × 18mm board with a unified I2C interface, RFOXiA eliminates the hardware assembly phase entirely and lets you focus on the logging pipeline itself.
The Hardware: What's Inside a Professional-Grade Sensor Module
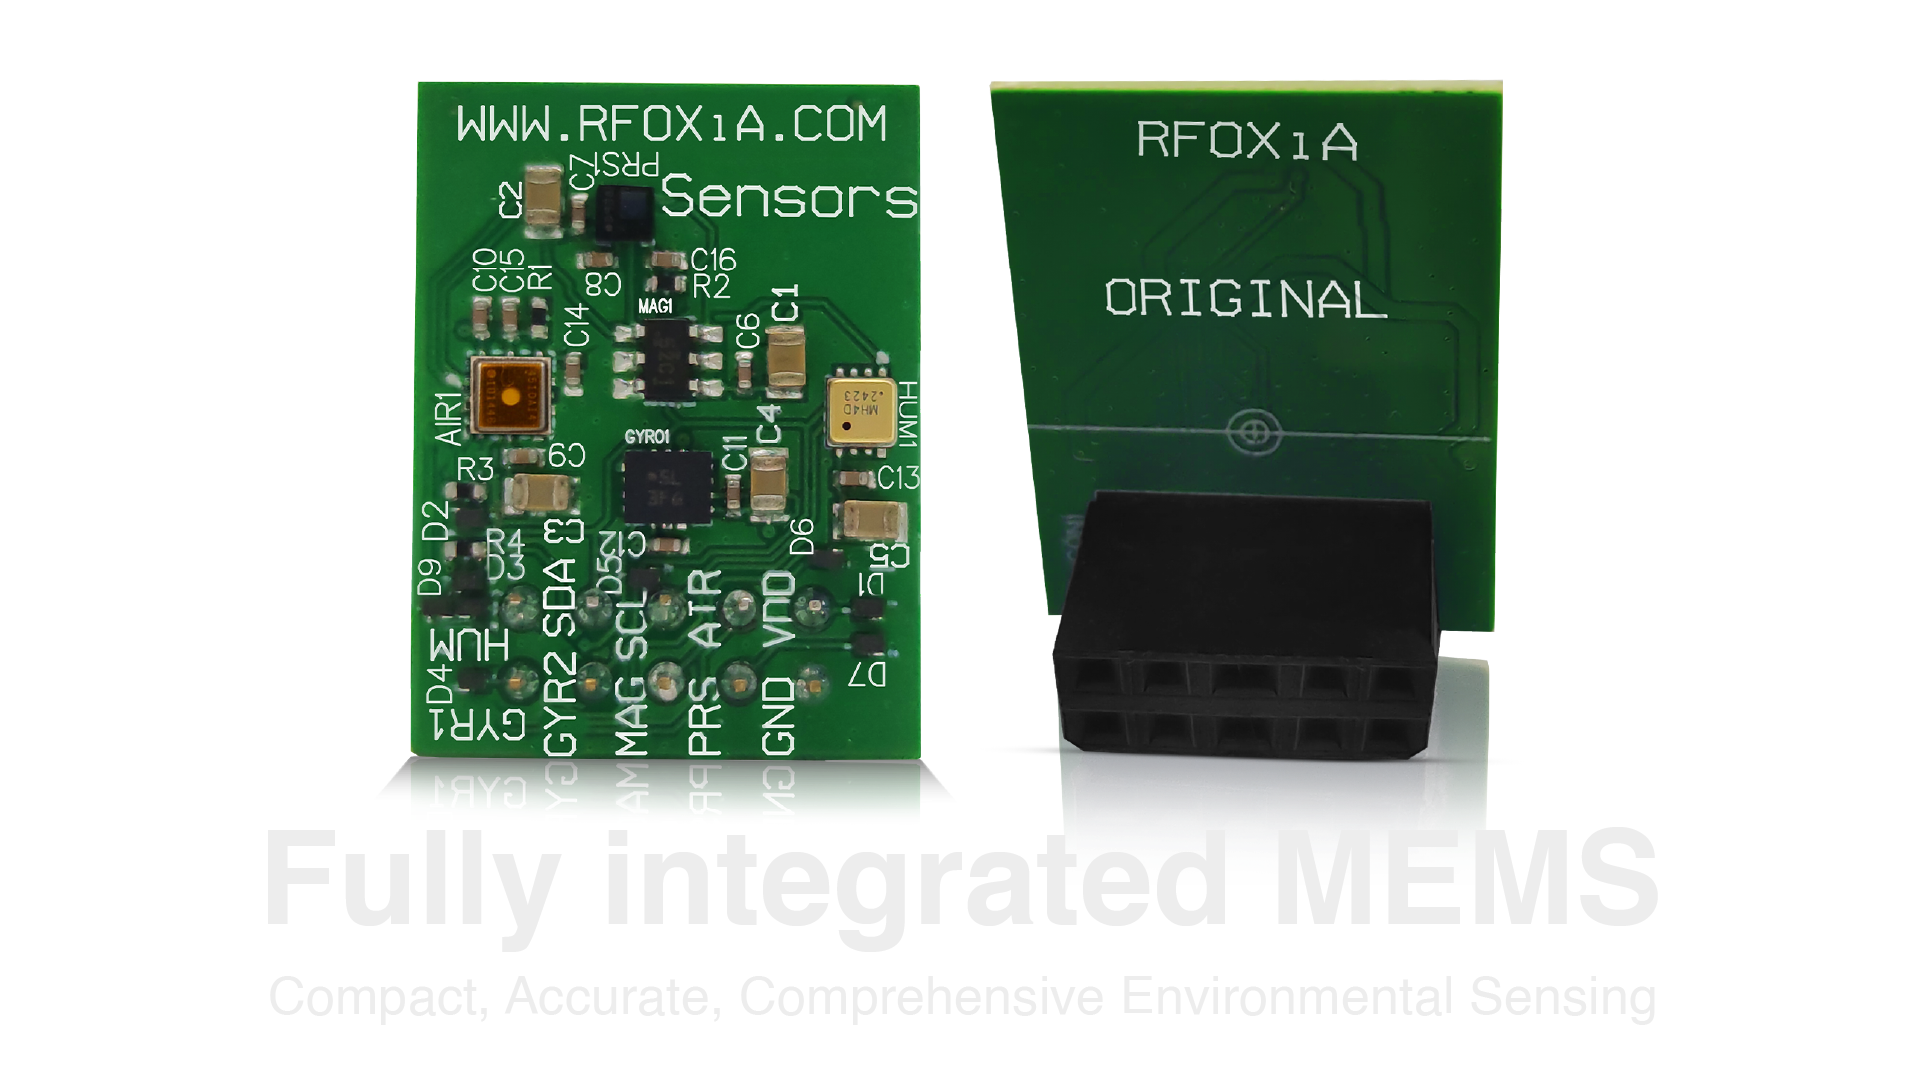
The MultiNav Pro+™ Sensors Module from RFOXiA packs the following components onto a single compact board:
- Accelerometer & Gyroscope: BMI270 from Bosch Sensortec — one of the most respected IMUs in professional drone and robotics applications
- Magnetometer: TMAG5273C1QDBVR from Texas Instruments — high-resolution 3-axis magnetic field sensor
- Air Pressure: LPS22HHTR from STMicroelectronics — absolute pressure sensor with exceptional stability
- Humidity & Temperature: MVH4003D from MEMSVision — combined sensor for accurate environmental monitoring
- Air Quality: ZMOD4510AI4R from Renesas — outdoor air quality sensor for ozone and nitrogen dioxide detection
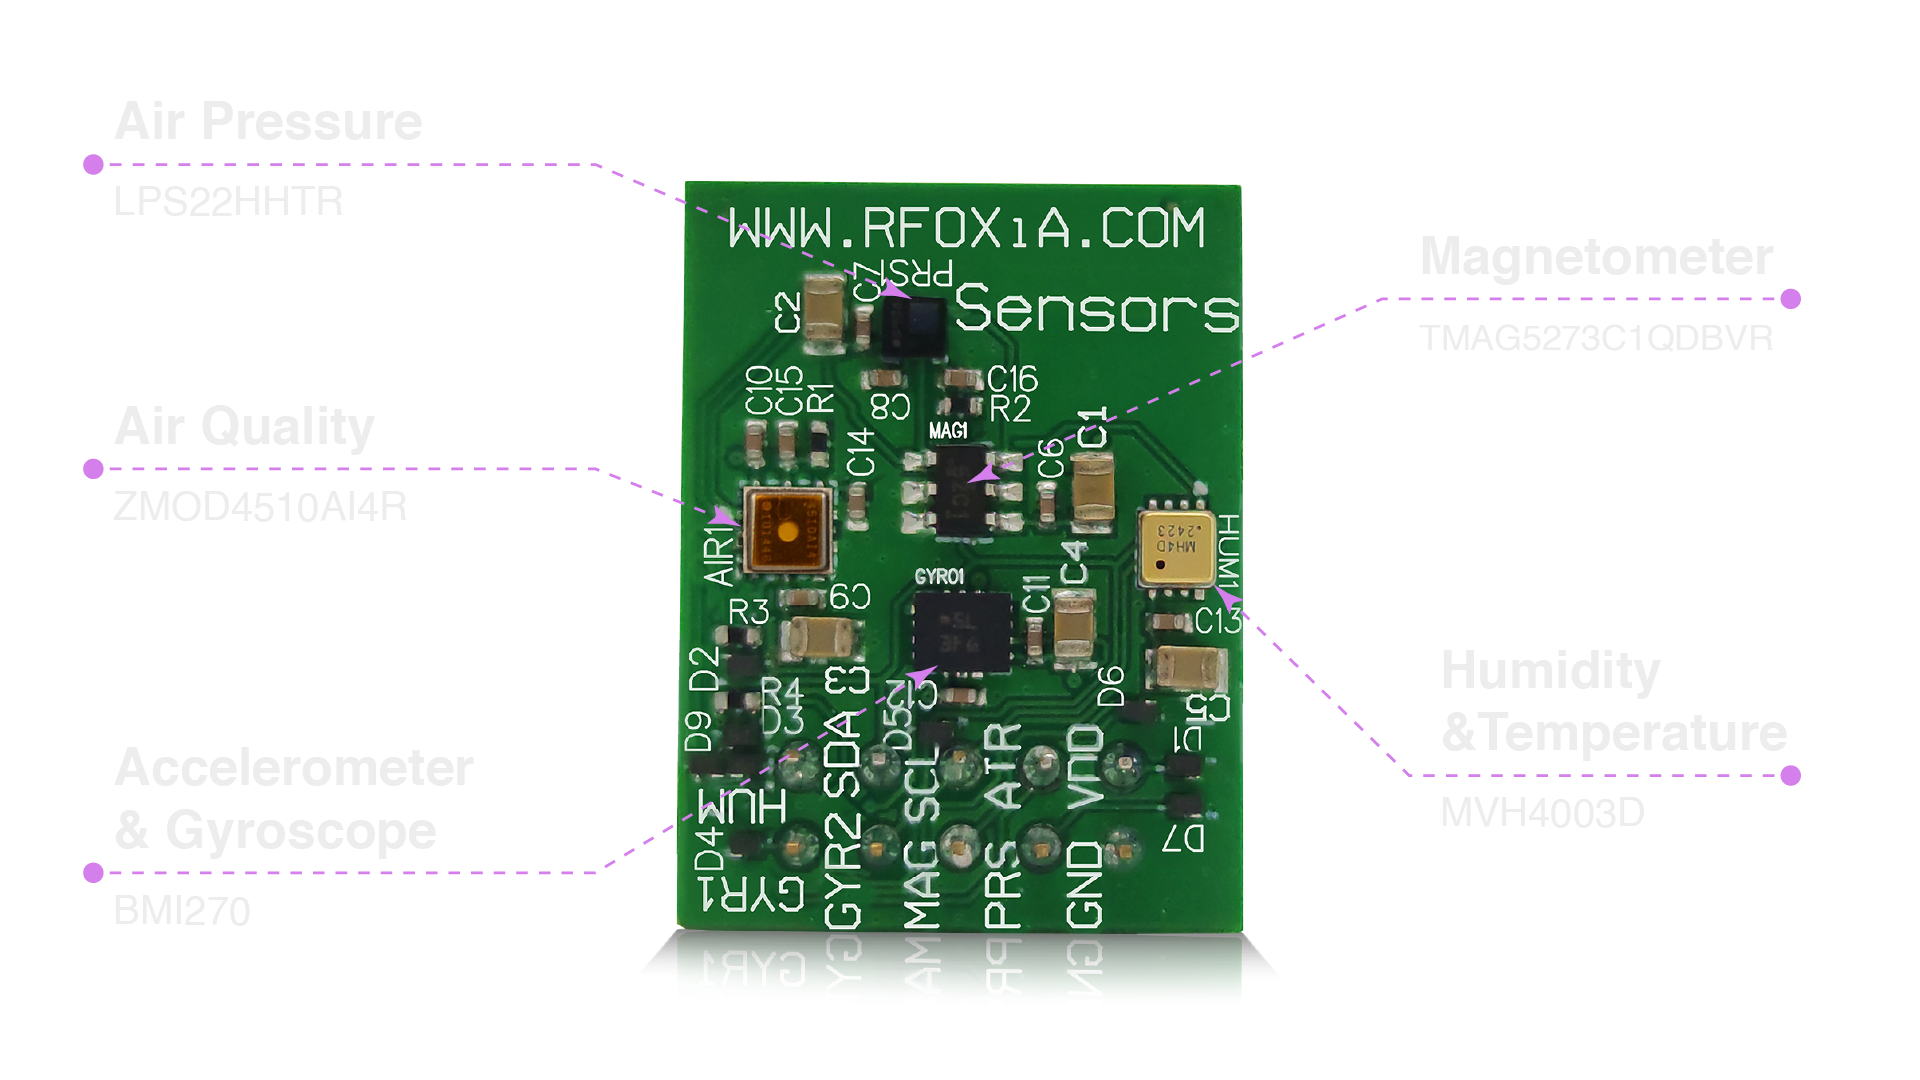
Every one of these ICs is a component-grade part used in professional and industrial applications. This isn't a collection of generic Chinese clones — it's a curated stack of best-in-class sensors from Bosch, Texas Instruments, STMicroelectronics, MEMSVision, and Renesas.
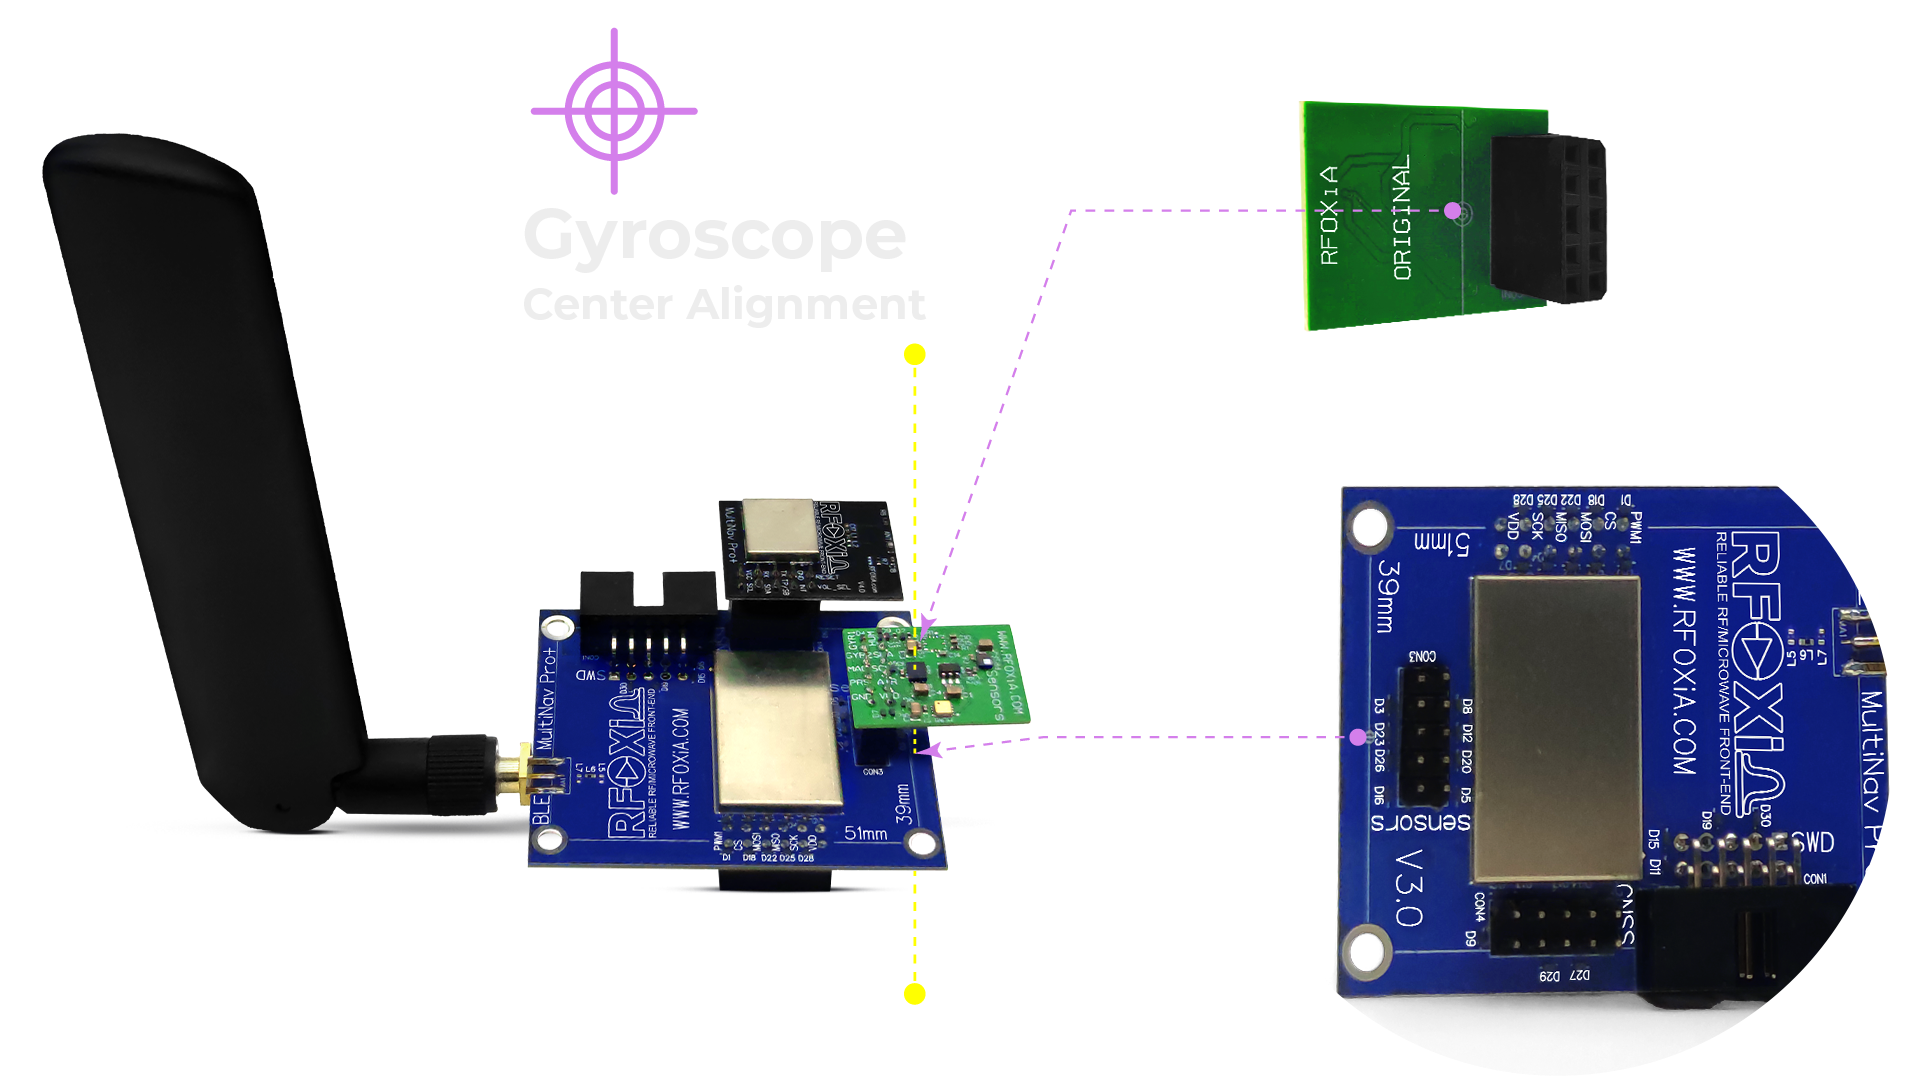
For Raspberry Pi developers, this matters because the quality of your logged data is directly limited by the quality of your sensors. Drift, noise, and non-linearity in cheap sensors don't just add error — they create systematic bias that corrupts any model or analysis you build on top of the data.
I2C Communication on Raspberry Pi: The Foundation of Multi-Sensor Logging
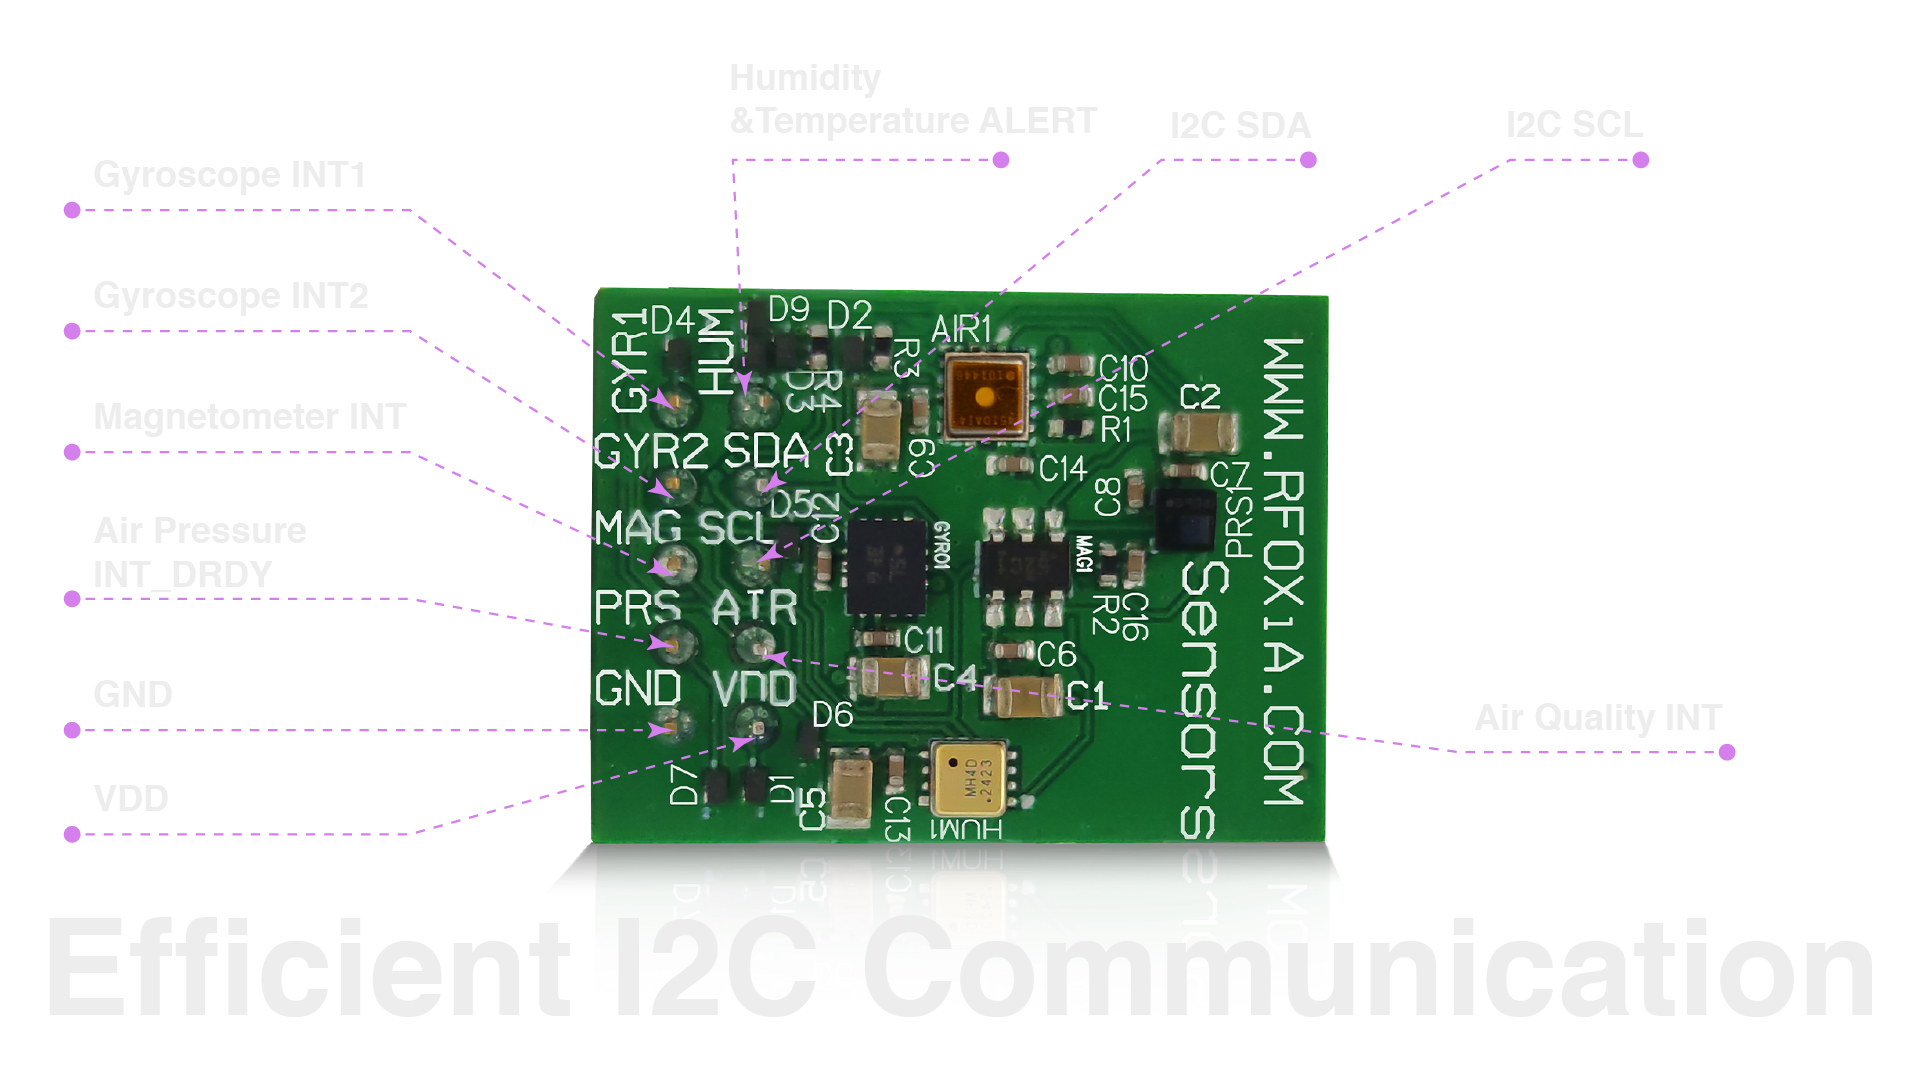
I2C (Inter-Integrated Circuit) is the dominant protocol for sensor communication in embedded systems, and it's natively supported on the Raspberry Pi's GPIO header. Understanding I2C deeply is essential to building reliable multi-sensor logging systems.
How I2C Works
I2C uses two wires — SDA (Serial Data) and SCL (Serial Clock) — to connect a master device (your Raspberry Pi) to multiple slave devices (your sensors). Each slave has a unique 7-bit address, allowing the master to address up to 127 devices on the same two-wire bus.
The MultiNav Pro+ handles this elegantly: all seven sensors share a single I2C bus, each with its own dedicated address, eliminating address conflicts and simplifying your wiring to four connections: VCC, GND, SDA, SCL.
Enabling I2C on Raspberry Pi
Before writing any Python code, you need to enable the I2C interface:
sudo raspi-config
# Navigate to: Interface Options > I2C > Enable
sudo reboot
Verify your sensors are detected:
sudo apt-get install i2c-tools
i2cdetect -y 1
You should see addresses populated in the grid for each sensor connected to the bus.
Installing Python Dependencies
sudo apt-get update
sudo apt-get install python3-pip python3-smbus
pip3 install smbus2 RPi.GPIO
Writing Your First Sensor Logging Script
Here's a foundational Python structure for reading and logging I2C sensor data on Raspberry Pi. This approach uses smbus2 for I2C communication and the csv and datetime modules for structured logging.
import smbus2
import csv
import time
from datetime import datetime

# I2C bus (1 for Raspberry Pi 2 and later)
bus = smbus2.SMBus(1)

# Define sensor addresses (check your module datasheet)
BMI270_ADDR = 0x68
LPS22_ADDR = 0x5D
MVH4003_ADDR = 0x44

def read_temperature(bus):
    """Read temperature from MVH4003D"""
    # Send measurement command
    bus.write_i2c_block_data(MVH4003_ADDR, 0x24, [0x00])
    time.sleep(0.1)
    data = bus.read_i2c_block_data(MVH4003_ADDR, 0x00, 6)
    raw_temp = (data[0] << 8) | data[1]
    temperature = -45 + (175 * raw_temp / 65535)
    return round(temperature, 2)

def read_pressure(bus):
    """Read barometric pressure from LPS22HHTR"""
    data = bus.read_i2c_block_data(LPS22_ADDR, 0x28 | 0x80, 3)
    raw_press = (data[2] << 16) | (data[1] << 8) | data[0]
    pressure = raw_press / 4096.0
    return round(pressure, 2)

# CSV logging setup
log_file = f"sensor_log_{datetime.now().strftime('%Y%m%d_%H%M%S')}.csv"

with open(log_file, mode='w', newline='') as f:
    writer = csv.writer(f)
    writer.writerow(['timestamp', 'temperature_c', 'pressure_hpa'])

    print(f"Logging to {log_file}. Press Ctrl+C to stop.")

    try:
        while True:
            timestamp = datetime.now().isoformat()
            temp = read_temperature(bus)
            pressure = read_pressure(bus)

            writer.writerow([timestamp, temp, pressure])
            f.flush()  # Ensure data is written immediately

            print(f"{timestamp} | Temp: {temp}°C | Pressure: {pressure} hPa")
            time.sleep(1)

    except KeyboardInterrupt:
        print("Logging stopped.")
This gives you timestamped CSV output that you can import directly into Excel, Pandas, or any analytics platform.
Advanced Logging: SQLite Database for Structured Queries
For longer-term deployments or multi-sensor systems, CSV files become unwieldy. SQLite is a far better choice — it's built into Python, requires no server, and supports full SQL queries on your logged data.
import sqlite3
import smbus2
import time
from datetime import datetime

conn = sqlite3.connect('sensor_data.db')
cursor = conn.cursor()

# Create table if it doesn't exist
cursor.execute('''
    CREATE TABLE IF NOT EXISTS sensor_readings (
        id INTEGER PRIMARY KEY AUTOINCREMENT,
        timestamp TEXT NOT NULL,
        temperature REAL,
        humidity REAL,
        pressure REAL,
        air_quality REAL,
        accel_x REAL,
        accel_y REAL,
        accel_z REAL
    )
''')
conn.commit()

def log_reading(timestamp, temp, hum, press, aq, ax, ay, az):
    cursor.execute('''
        INSERT INTO sensor_readings
        (timestamp, temperature, humidity, pressure, air_quality, accel_x, accel_y, accel_z)
        VALUES (?, ?, ?, ?, ?, ?, ?, ?)
    ''', (timestamp, temp, hum, press, aq, ax, ay, az))
    conn.commit()
With this structure, you can query your data with full SQL power:
-- Average temperature by hour
SELECT strftime('%Y-%m-%d %H', timestamp) as hour,
       AVG(temperature) as avg_temp
FROM sensor_readings
GROUP BY hour;

-- Find all readings where air quality exceeded threshold
SELECT * FROM sensor_readings
WHERE air_quality > 150
ORDER BY timestamp DESC;
Real-Time Data Streaming to Remote Servers
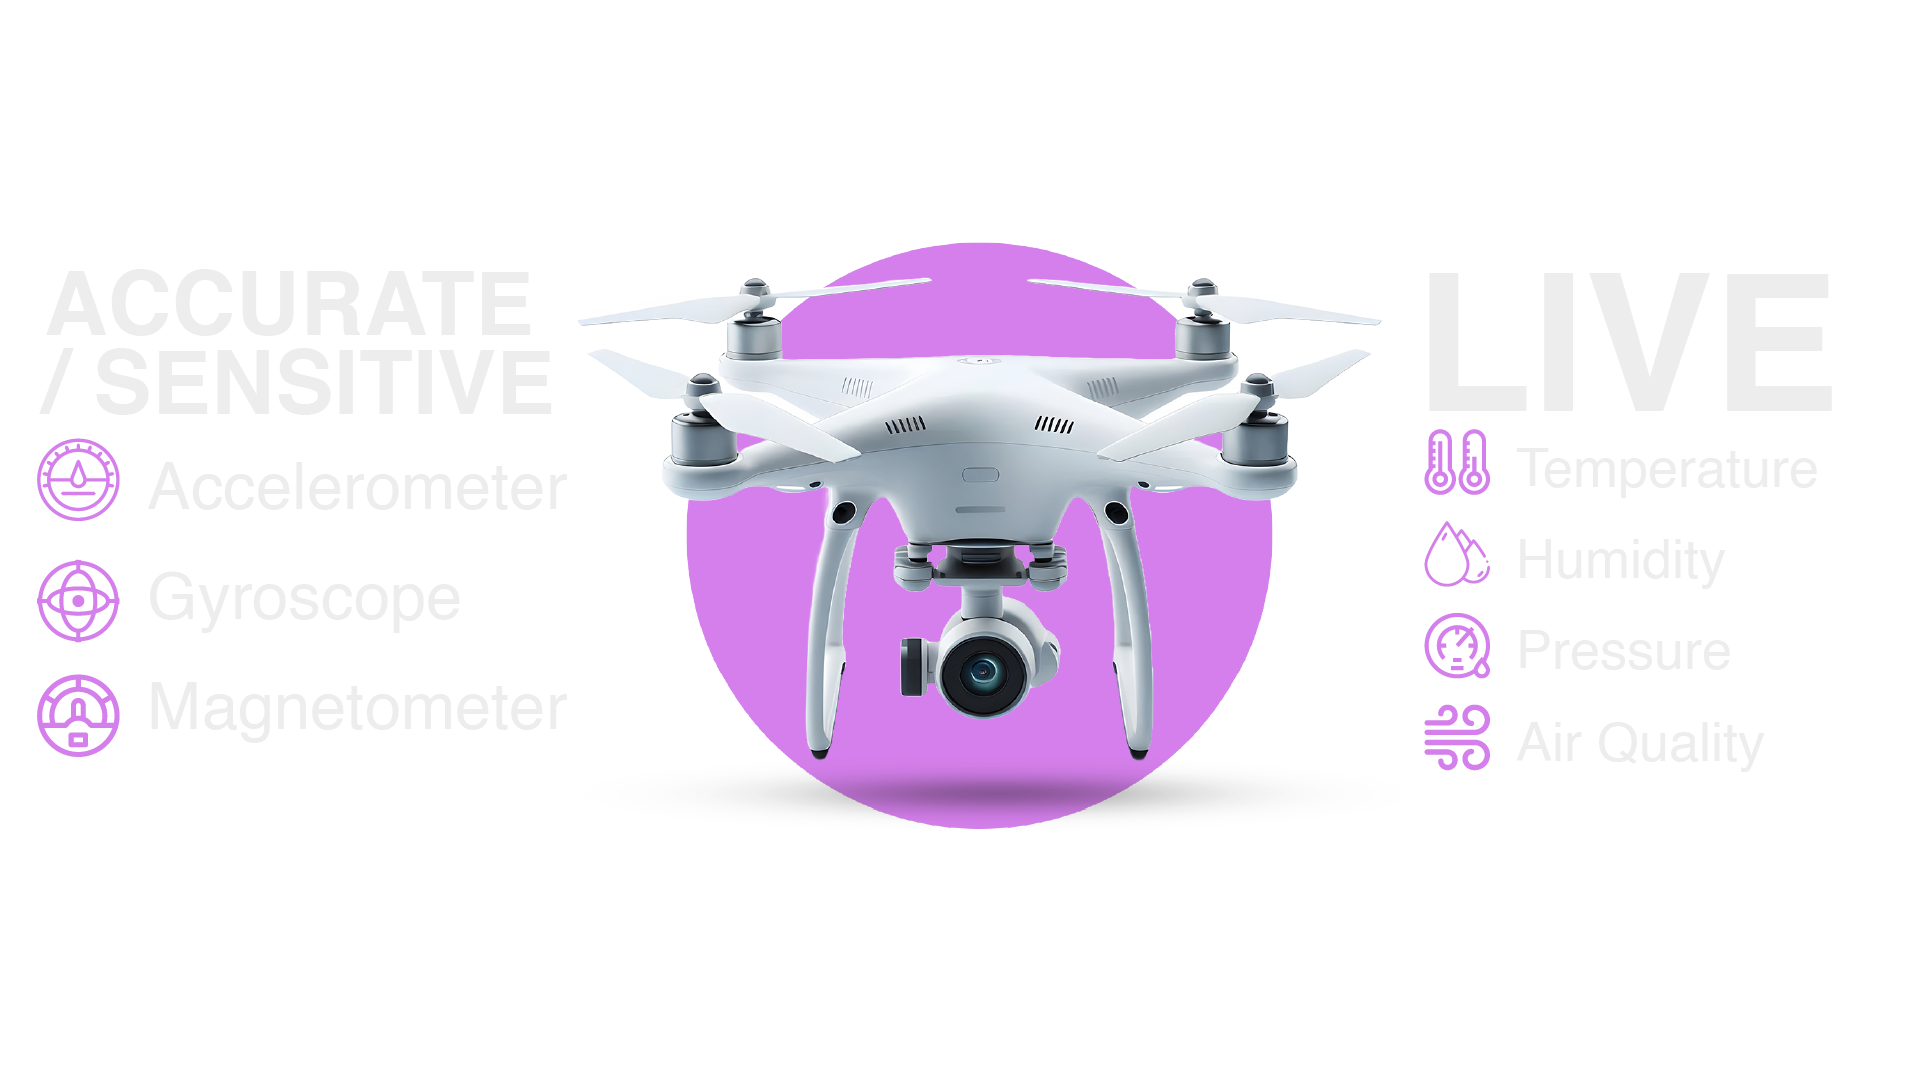
Local logging is powerful, but real-time streaming unlocks the next level: live dashboards, remote monitoring, and participation in distributed data networks. The MultiNav Pro+™ Sensors Module is purpose-built for this use case.
When you connect the Sensors Module to a Raspberry Pi and stream verified environmental data — temperature, humidity, pressure, air quality, and GPS location — you can contribute to the RFOXiA data network and earn daily rewards for your verified data contributions.
Here's a simple MQTT-based streaming implementation:
import paho.mqtt.client as mqtt
import json
import time
from datetime import datetime

# Install: pip3 install paho-mqtt

BROKER = "your-mqtt-broker-address"
TOPIC = "rfoxia/sensors/node_001"

client = mqtt.Client()
client.connect(BROKER, 1883, 60)

def publish_reading(temp, hum, press, aq, lat, lon):
    payload = json.dumps({
        "timestamp": datetime.utcnow().isoformat(),
        "temperature": temp,
        "humidity": hum,
        "pressure": press,
        "air_quality": aq,
        "location": {"lat": lat, "lon": lon}
    })
    client.publish(TOPIC, payload)
    print(f"Published: {payload}")

# Main loop
while True:
    # Read your sensors here
    publish_reading(22.5, 45.0, 1013.25, 95.0, 25.2048, 55.2708)
    time.sleep(5)
This pattern is exactly how the RFOXiA data network operates — Raspberry Pi nodes with Sensors Modules stream verified outdoor environmental data, which is aggregated and sold to enterprise buyers including agri-tech companies, smart city operators, insurance firms, and research institutions.
Compact Design: Why Size Matters in the Field
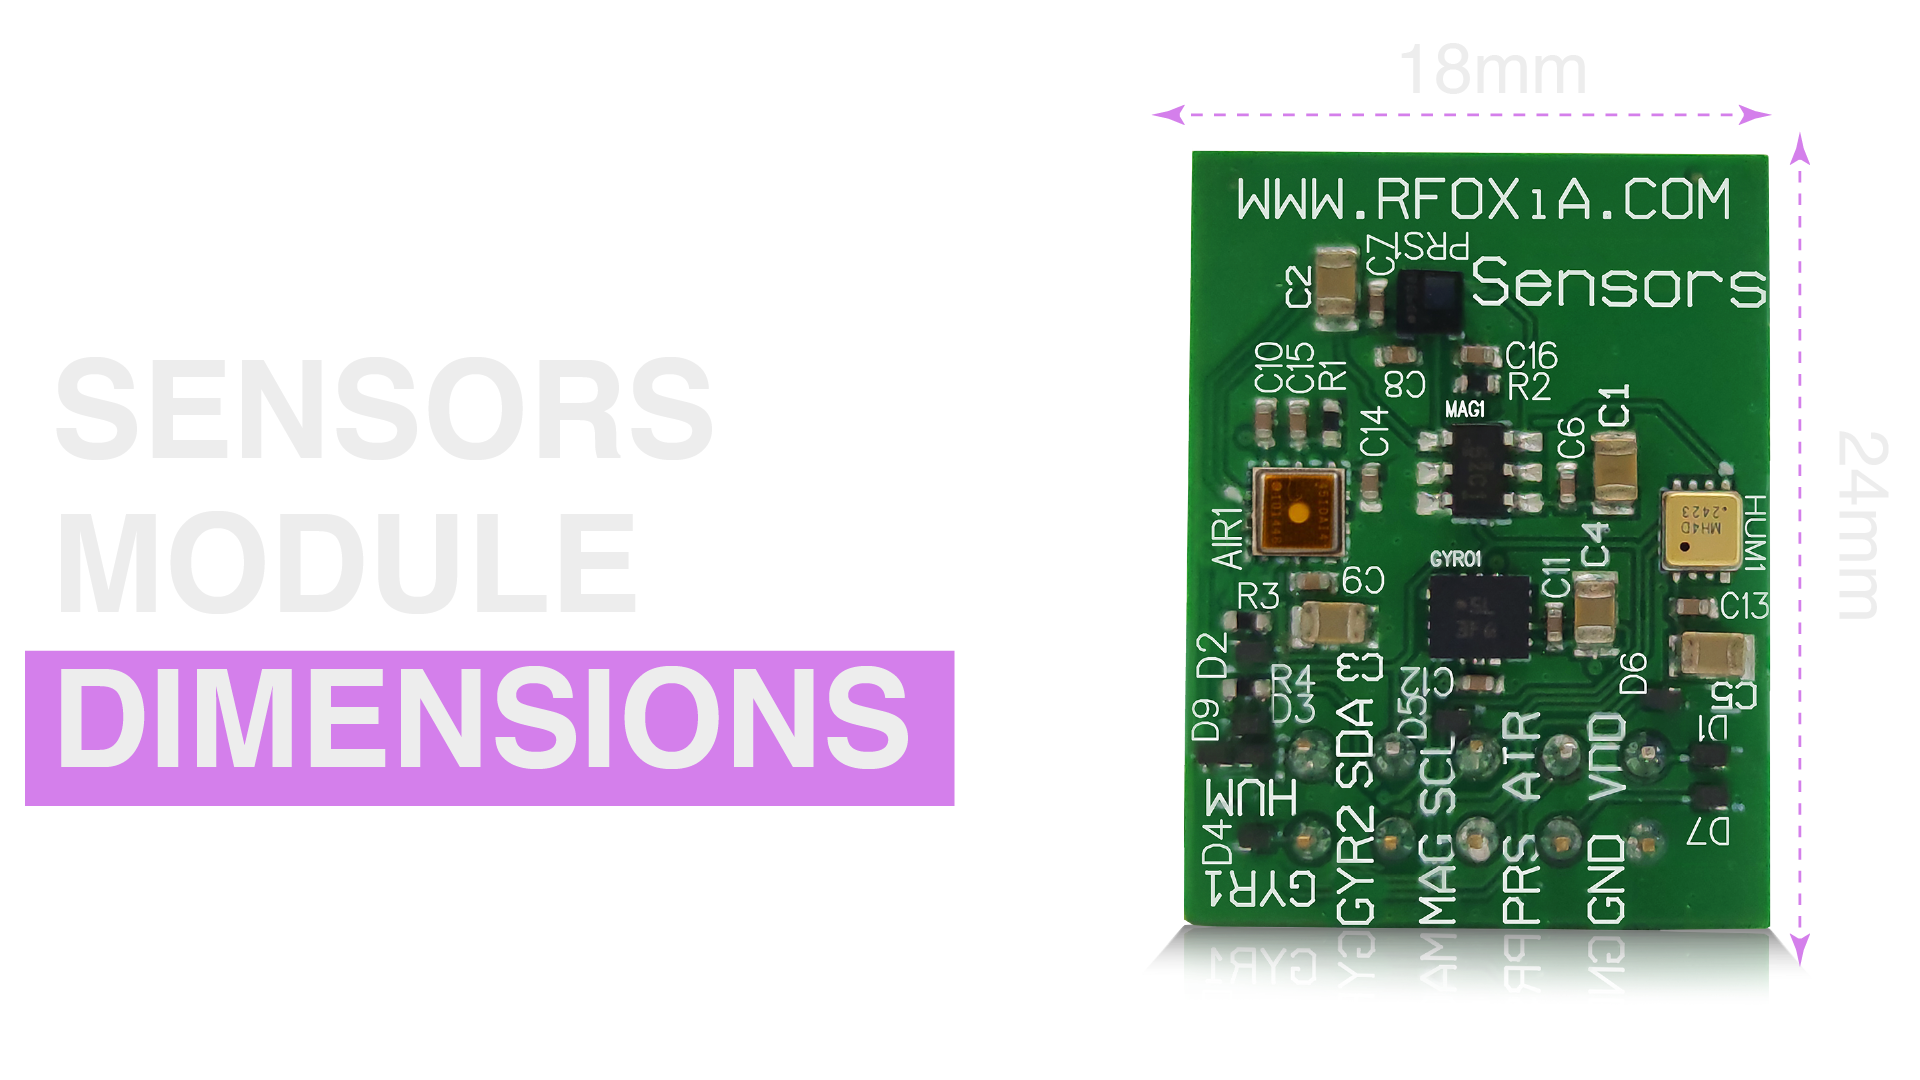
At 24mm × 18mm, the MultiNav Pro+™ Sensors Module is small enough to fit into drone payloads, wearable devices, and enclosures where a full breakout board stack simply won't fit. For Raspberry Pi Zero deployments in particular — where the entire compute platform is barely larger than a credit card — module size is a genuine engineering constraint, not just an aesthetic preference.
When you're designing a field-deployed logging node, consider:
- Enclosure volume: Smaller PCBs mean smaller waterproof enclosures and lower material cost
- Thermal management: Compact layouts reduce thermal gradients between sensors that could affect calibration
- Wiring harness: Fewer connector points means fewer failure modes in vibration-prone environments like drones
- Weight budget: For aerial platforms, every gram matters — a 24mm × 18mm module vs. seven discrete breakouts is a meaningful weight difference
Handling Sampling Rates and Data Integrity
One of the most overlooked aspects of sensor logging is sampling rate management. Different sensors have different maximum output data rates, and your logging loop must respect these constraints.
For the sensors in the MultiNav Pro+ stack:
- BMI270 IMU: Up to 6400 Hz for accelerometer, 3200 Hz for gyroscope — far faster than most logging needs
- LPS22HHTR: Up to 200 Hz for pressure readings
- MVH4003D: Measurement cycle ~8ms minimum
- ZMOD4510: Measurement cycle ~6 seconds minimum for air quality
This means your logging loop timing must be governed by the slowest sensor (air quality at ~6s intervals) unless you log each sensor at its own native rate using separate threads.
import threading

class SensorLogger:
    def __init__(self):
        self.imu_data = {}
        self.env_data = {}
        self.aq_data = {}

    def log_imu(self):
        while True:
            # Read BMI270 at 100Hz
            self.imu_data = read_imu()
            time.sleep(0.01)

    def log_environment(self):
        while True:
            # Read temp/humidity/pressure at 1Hz
            self.env_data = read_environment()
            time.sleep(1)

    def log_air_quality(self):
        while True:
            # Read ZMOD4510 at 0.1Hz
            self.aq_data = read_air_quality()
            time.sleep(10)

    def start(self):
        threads = [
            threading.Thread(target=self.log_imu, daemon=True),
            threading.Thread(target=self.log_environment, daemon=True),
            threading.Thread(target=self.log_air_quality, daemon=True)
        ]
        for t in threads:
            t.start()
This threaded approach lets each sensor operate at its natural rate while the main thread handles storage and transmission.
Visualizing Your Logged Data
Raw numbers in a CSV or SQLite database are only half the story. Visualization closes the feedback loop and reveals patterns that tabular data hides.
Option 1: Matplotlib for Local Analysis
import pandas as pd
import matplotlib.pyplot as plt

df = pd.read_csv('sensor_log.csv', parse_dates=['timestamp'])

fig, axes = plt.subplots(2, 2, figsize=(12, 8))

df.plot(x='timestamp', y='temperature_c', ax=axes[0,0], title='Temperature')
df.plot(x='timestamp', y='humidity', ax=axes[0,1], title='Humidity')
df.plot(x='timestamp', y='pressure_hpa', ax=axes[1,0], title='Pressure')
df.plot(x='timestamp', y='air_quality', ax=axes[1,1], title='Air Quality')

plt.tight_layout()
plt.savefig('sensor_dashboard.png', dpi=150)
plt.show()
Option 2: Grafana + InfluxDB for Live Dashboards
For production deployments, the Grafana + InfluxDB stack is the industry standard:
# Install InfluxDB on Raspberry Pi
curl -sL https://repos.influxdata.com/influxdb.key | sudo apt-key add -
echo "deb https://repos.influxdata.com/debian stable main" | sudo tee /etc/apt/sources.list.d/influxdb.list
sudo apt-get update && sudo apt-get install influxdb
sudo systemctl start influxdb
This gives you a live web dashboard accessible from any browser on your network — professional-grade visualization with zero cost.
Applications: What You Can Build When You Know How to Log Sensor Data Raspberry Pi Projects Generate
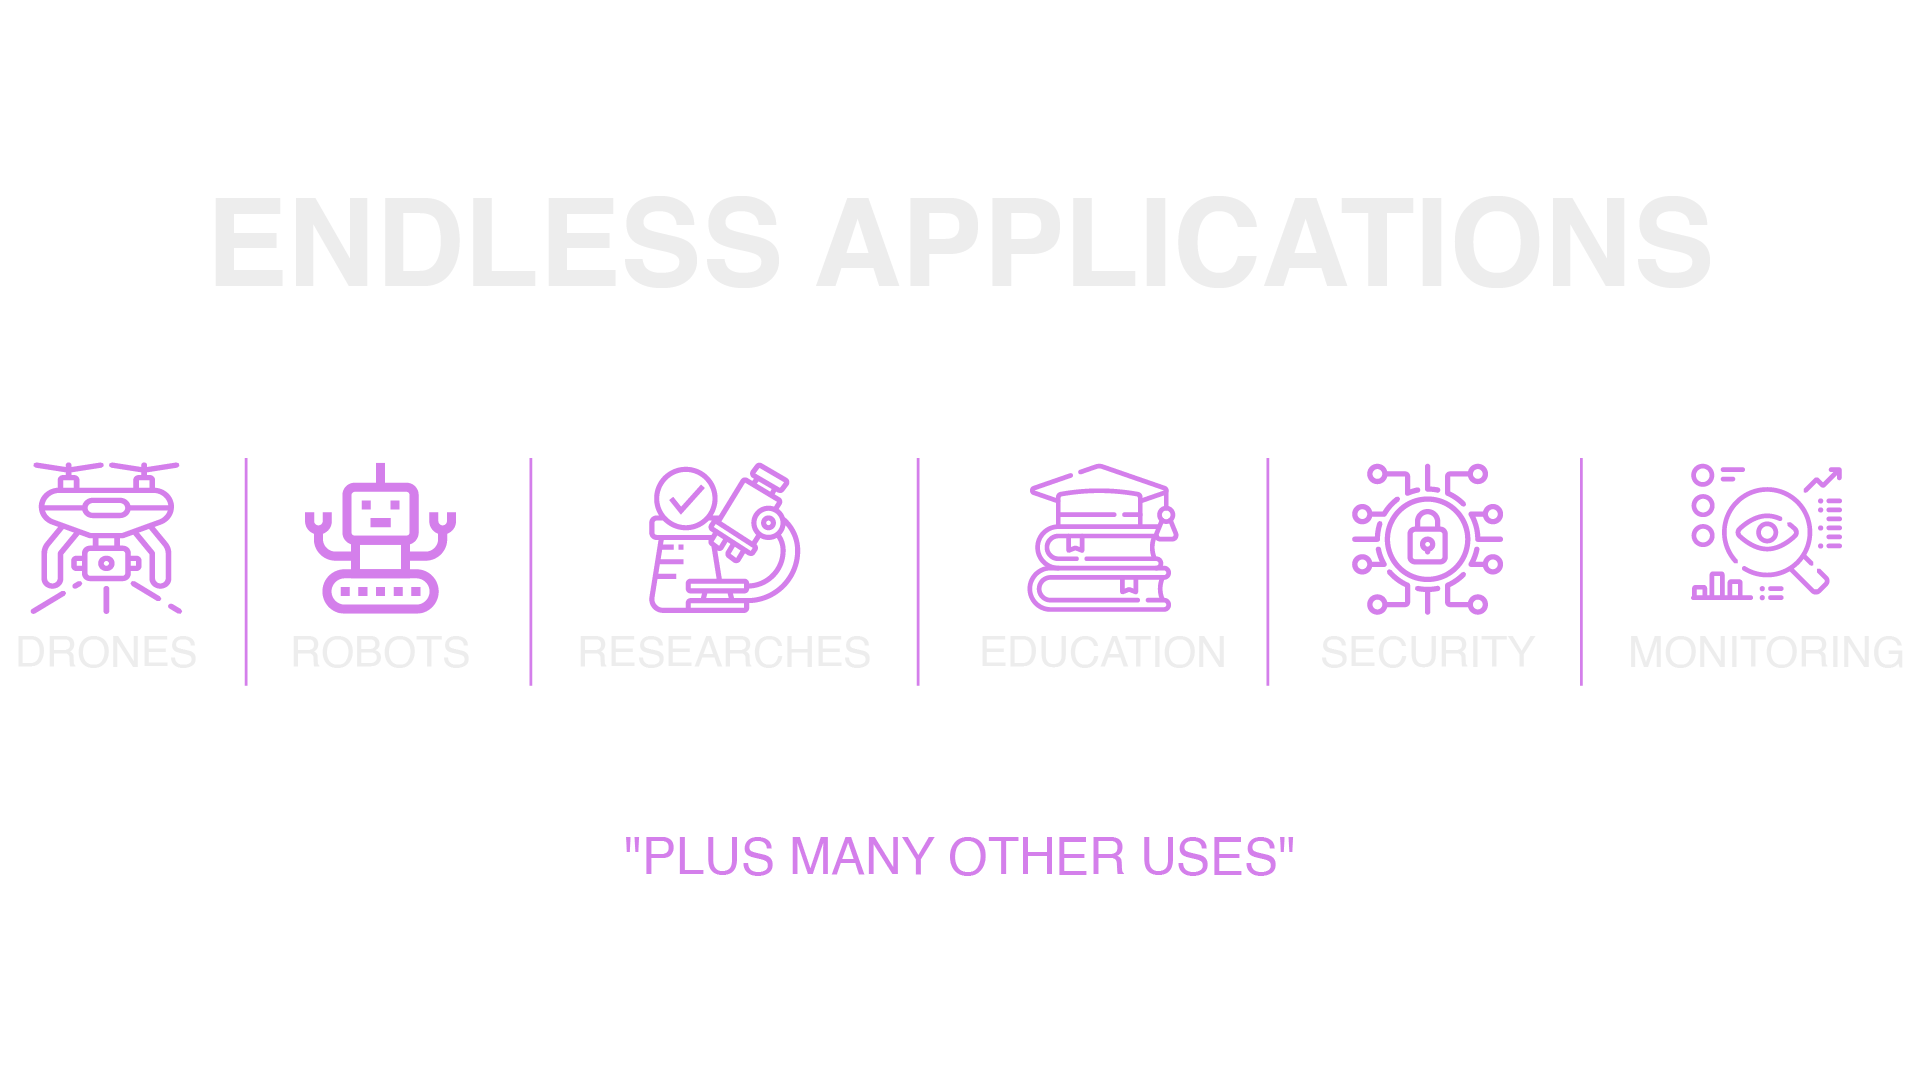
Once you have a reliable sensor logging pipeline running on Raspberry Pi with quality hardware like the MultiNav Pro+™ Sensors Module, the applications are genuinely limitless:
Environmental Monitoring Stations
Deploy weatherproof enclosures with Raspberry Pi Zero W + Sensors Module at multiple locations. Log micro-climate data at street level — temperature, humidity, pressure, and air quality at second-level resolution. This is data that no public weather API provides.
Drone Telemetry Systems
Mount the Sensors Module on a drone payload. Log IMU data (accelerometer + gyroscope) alongside environmental conditions during every flight. Build datasets that let you correlate air turbulence with sensor readings, optimize flight paths, and detect mechanical anomalies.
Precision Agriculture Nodes
Deploy sensor nodes across agricultural fields. Log soil-adjacent microclimate data — temperature gradients, humidity, air pressure, and VOC readings that correlate with plant stress or pest activity. Agri-tech companies buy this kind of hyper-local data at premium rates.
Smart Building Systems
Log indoor air quality, temperature, and humidity across multiple rooms or floors. Detect CO2 buildup, humidity spikes that predict mold growth, or HVAC inefficiencies before they become maintenance events.
Research and Academic Projects
The combination of motion (IMU + magnetometer) and environmental sensing (temp, humidity, pressure, air quality) in a single package makes the MultiNav Pro+ ideal for academic research projects that need to correlate physical dynamics with environmental conditions.
Data Network Contribution
This is the uniquely compelling use case for RFOXiA users. Deploy your Raspberry Pi + Sensors Module outdoors with GPS validation, stream verified data to the RFOXiA network, and earn daily rewards — up to $0.40/day per node — while your hardware does the work automatically.
Upgrading Your Stack: From Raspberry Pi to Full Wireless Deployment
If your project evolves beyond a wired Raspberry Pi node — toward autonomous wireless deployment in the field — the RFOXiA Integrated Sensors Module is designed to integrate seamlessly with the rest of the RFOXiA ecosystem:
- BLE Module (MultiNav Pro+) — adds 5km ground-to-ground or 15-20km man-to-drone wireless range for cable-free data transmission
- GNSS Module — adds 1.5m accuracy GPS at 18Hz for location-stamped data streams
- Power/Program Kit — supercapacitor-based power with 5-minute charge and 24-hour runtime for truly autonomous field deployment
This stack eliminates every reason to be tethered: no cables, no WiFi dependency, no cellular connectivity required. Your sensor node runs indefinitely, streams data wirelessly over kilometers, and stamps every reading with precise GPS coordinates.
For Raspberry Pi developers looking to understand how to log sensor data Raspberry Pi deployments can support at professional scale, this wireless extension represents the natural evolution of your platform.
Common Pitfalls and How to Avoid Them
Clock Drift
Raspberry Pi doesn't have a battery-backed RTC. If power is lost, the system clock resets. Fix: use a DS3231 RTC module, or sync via NTP on every boot.
I2C Bus Lockup
If a sensor stops responding mid-transaction, it can lock the entire I2C bus. Fix: implement bus reset recovery and timeout handling in your driver code.
SD Card Corruption
Raspberry Pi SD cards are vulnerable to corruption during power loss. Fix: use a high-endurance SD card, enable journaled filesystem, and implement write buffering.
Sensor Warm-Up Time
Many sensors — especially air quality ICs like the ZMOD4510 — require a warm-up period before readings are stable. Fix: discard the first N readings on startup and implement a warm-up timer in your initialization code.
Floating Point Precision
When logging to CSV or database, floating point formatting matters. Fix: always specify decimal precision explicitly (e.g., round(value, 2)) to prevent spurious precision in your logged data.
Summary: Building a Professional Sensor Logging System on Raspberry Pi
Learning how to log sensor data Raspberry Pi platforms can capture is a foundational skill that scales from weekend hobby projects to professional IoT deployments and enterprise data networks. The key decisions that separate reliable professional systems from fragile hobby builds are:
- Hardware quality — Component-grade sensors from Bosch, TI, ST, and Renesas, not generic breakouts
- Unified interface — All sensors on a single I2C bus with dedicated addresses
- Compact integration — One board instead of seven, for reliability and space efficiency
- Structured storage — SQLite or InfluxDB instead of raw CSV for queryable historical data
- Threaded sampling — Each sensor operating at its natural rate, not governed by the slowest
- Real-time streaming — MQTT or HTTP push for live dashboards and network contribution
- Autonomous power — Supercapacitor-based systems for uninterrupted field deployment
The RFOXiA Integrated Sensors Module addresses points 1 through 3 completely out of the box at $39 — a price point that makes professional-grade sensor logging accessible to any developer, researcher, or engineer who wants to build something real.
Whether you're deploying a single monitoring node on your roof or building a distributed network of sensors that earns passive income from hyper-local environmental data, the foundation is the same: quality hardware, clean code, and a logging pipeline you can trust.
Start there. The rest is just building.
Ready to upgrade your sensor stack? Explore the MultiNav Pro+™ Sensors Module and the full RFOXiA ecosystem at rfoxia.com.
Written by: Moamen Mohamed LinkedIn